BCG Matrix
It has been many years now that I was first introduced to the BCG Matrix, a chart that had been created by Bruce Henderson for the Boston Consulting Group in 1970 to help corporations with analyzing their business units or product lines.
This helps a company allocate resources and is used as an analytical tool in brand marketing, product management, strategic management, and portfolio analysis. I thought maybe it would be a good idea posting about the matrix in these bad economical days and it might also help lots of people reviewing things around them, I guess the matrix can be used for many purposes in life.
Nowadays lots of people need to draw the matrix and spend some time on it !!!
Just as simulation example, OECD report is saying that the US economy will grow 1.4% this year and would likely contract 0.9 percent next year.
U.S. household wealth has taken an estimated $7 trillion hit from the tumbling housing and stock markets, and consumers are already curbing spending to try to recoup some of those losses.
The Boston Consulting Group is a global management consulting firm and the world’s leading advisor on business strategy. In their words: “We partner with clients in all sectors and regions to identify their highest-value opportunities, address their most critical challenges, and transform their businesses.”
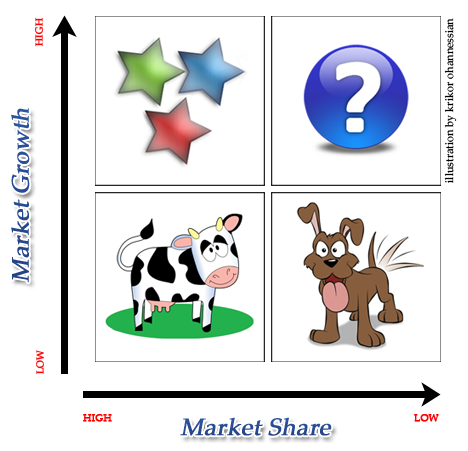
To use the BCG matrix, analysts plot a scatter graph to rank the business units or products on the basis of their relative market shares and growth rates. The BCG Chart has four quadrants called: Cash Cows, Dogs, Stars & Question Marks.
- Cash cows are units with high market share in a slow-growing industry. These units typically generate cash in excess of the amount of cash needed to maintain the business. They are regarded as staid and boring, in a “mature” market, and every corporation would be thrilled to own as many as possible. They are to be “milked” continuously with as little investment as possible, since such investment would be wasted in an industry with low growth.
- Dogs, or more charitably called pets, are units with low market share in a mature, slow-growing industry. These units typically “break even”, generating barely enough cash to maintain the business’s market share. Though owning a break-even unit provides the social benefit of providing jobs and possible synergies that assist other business units, from an accounting point of view such a unit is worthless, not generating cash for the company. They depress a profitable company’s return on assets ratio, used by many investors to judge how well a company is being managed. Dogs, it is thought, should be sold off.
- Stars are units with a high market share in a fast-growing industry. The hope is that stars become the next cash cows. Sustaining the business unit’s market leadership may require extra cash, but this is worthwhile if that’s what it takes for the unit to remain a leader. When growth slows, stars become cash cows if they have been able to maintain their category leadership, or they move from brief stardom to dogdom.
- Question marks (also known as problem child) are growing rapidly and thus consume large amounts of cash, but because they have low market shares they do not generate much cash. The result is a large net cash consumption. A question mark has the potential to gain market share and become a star, and eventually a cash cow when the market growth slows. If the question mark does not succeed in becoming the market leader, then after perhaps years of cash consumption it will degenerate into a dog when the market growth declines. Question marks must be analyzed carefully in order to determine whether they are worth the investment required to grow market share.


![Reblog this post [with Zemanta]](http://img.zemanta.com/reblog_e.png?x-id=7240fdf8-0b61-40d2-99e5-8adeee47a2ca)
